
Measure
the Real Impact of TV
on Your Digital Results
Meet TV Attribution to optimize your TV plan, get actionable insights and boost ROI.
Your TV Advertising,
Finally Transparent
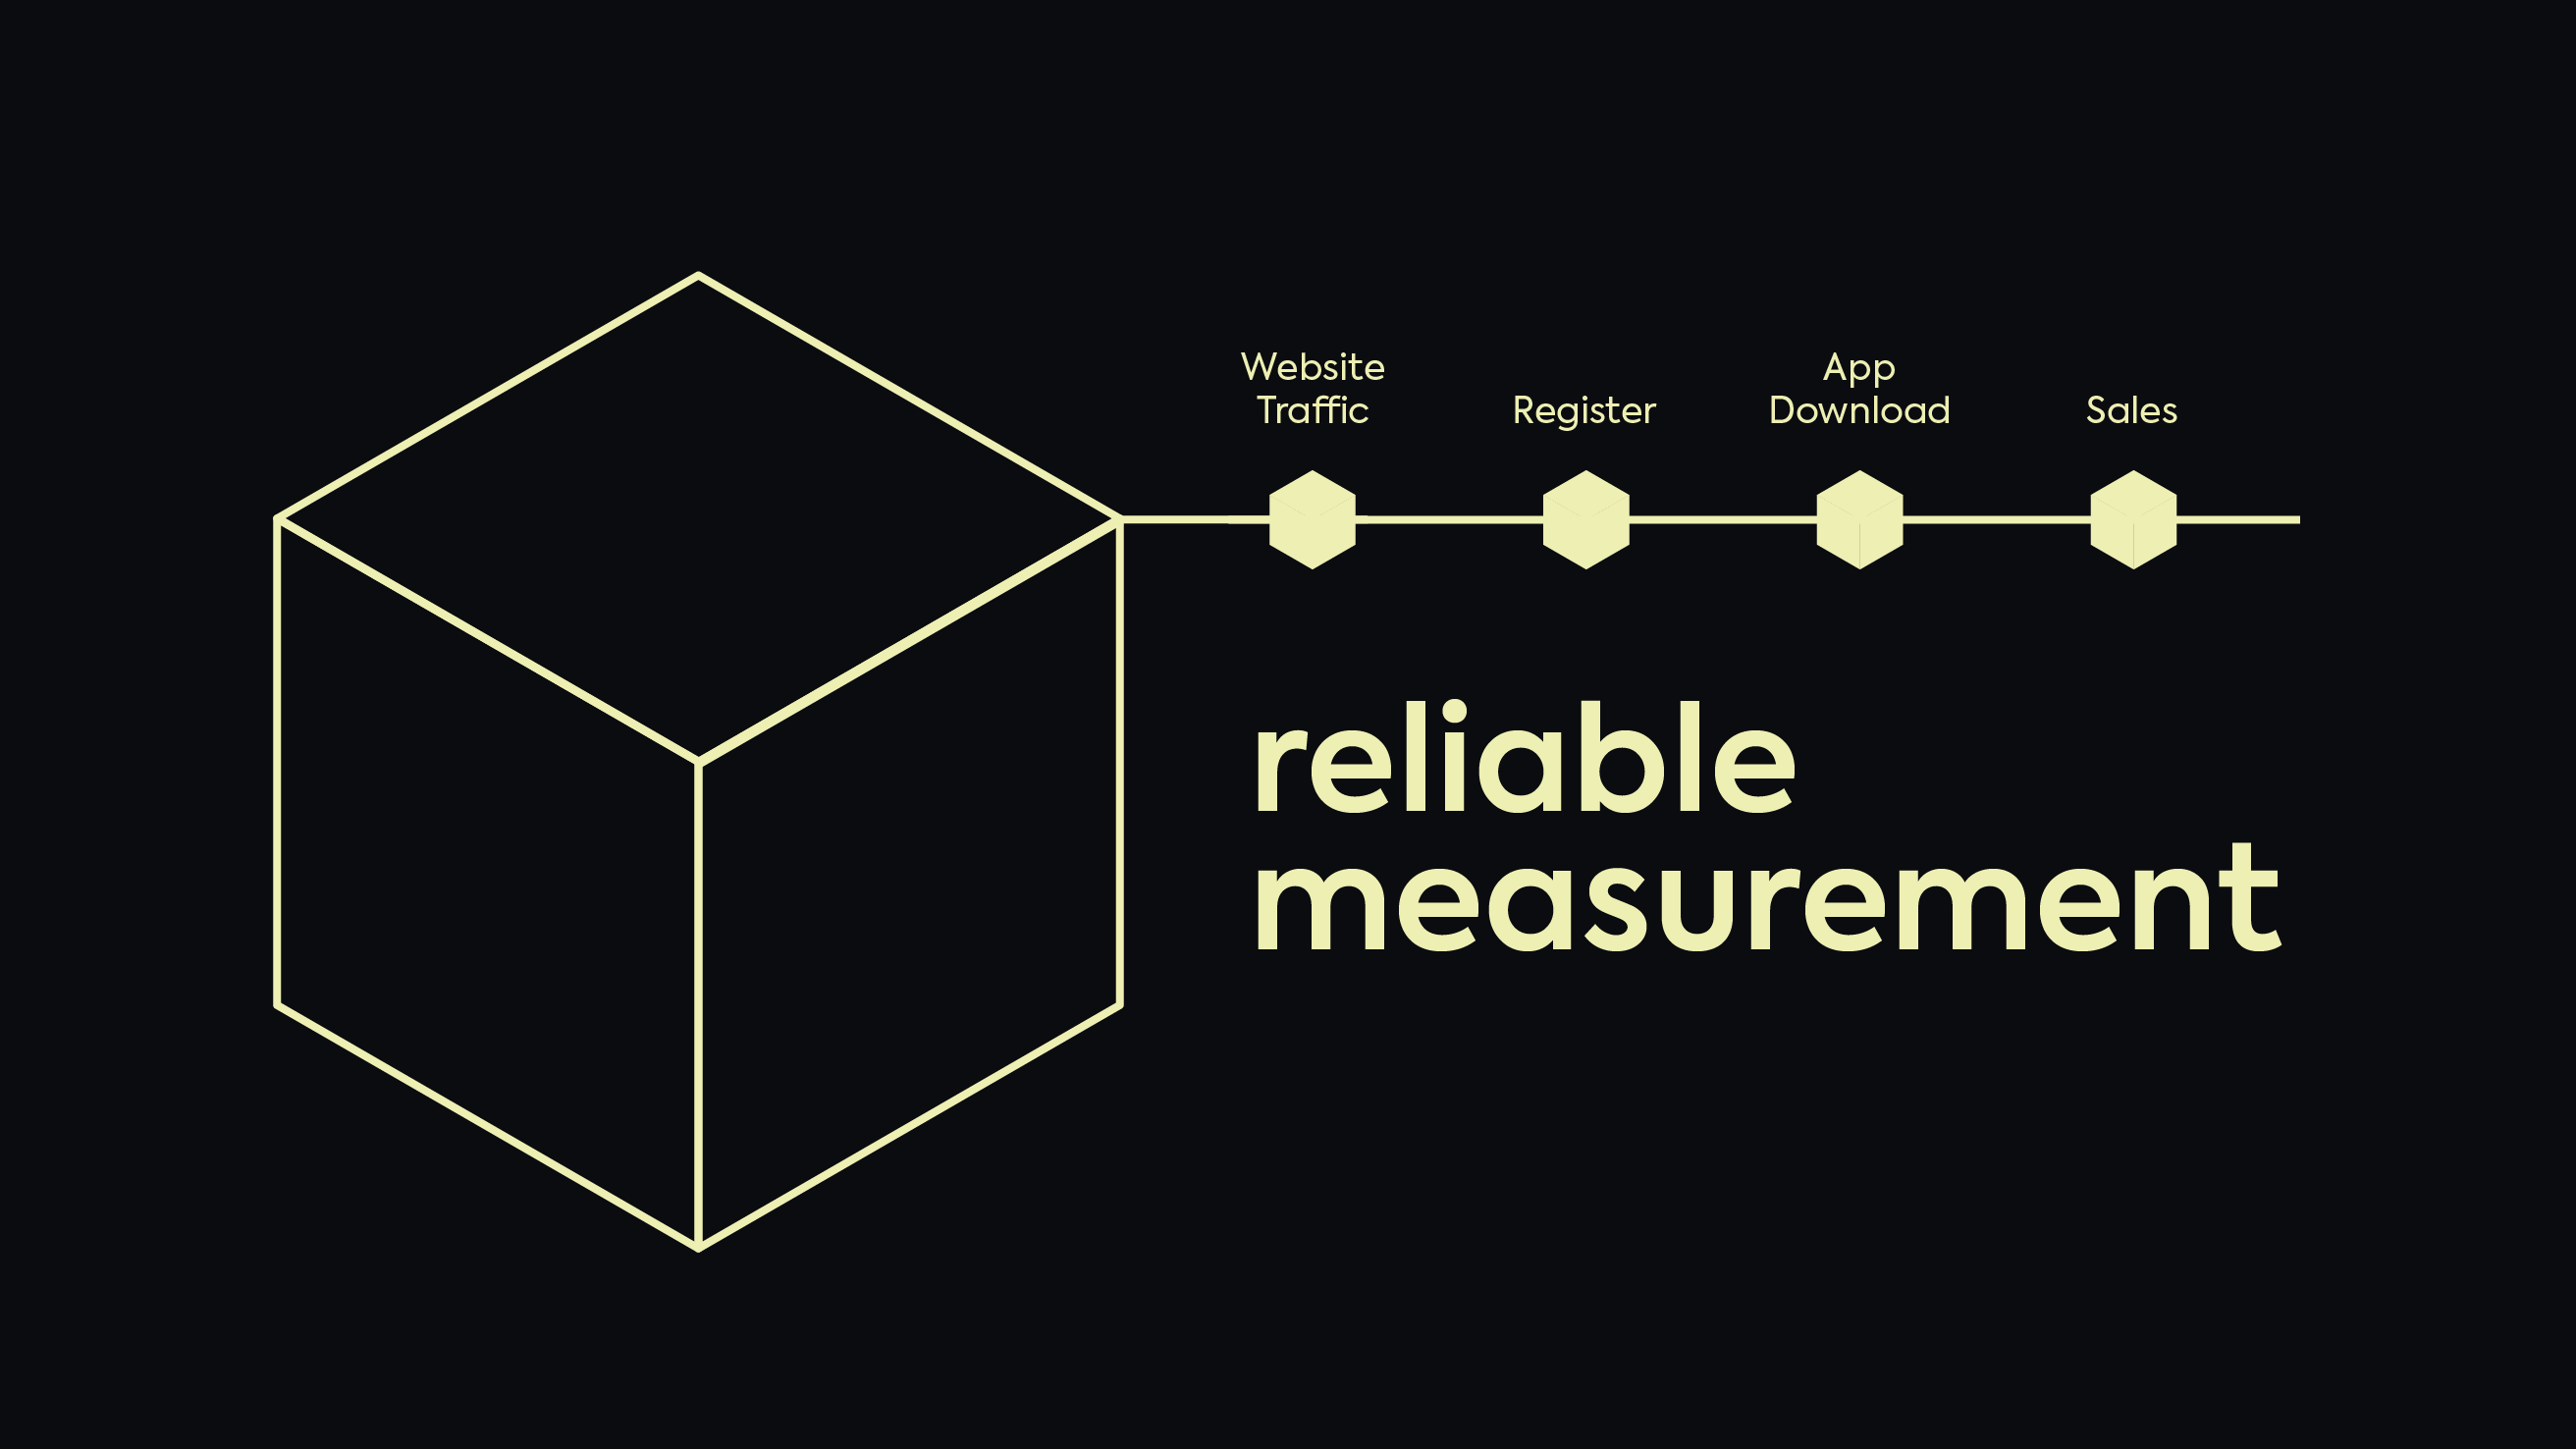
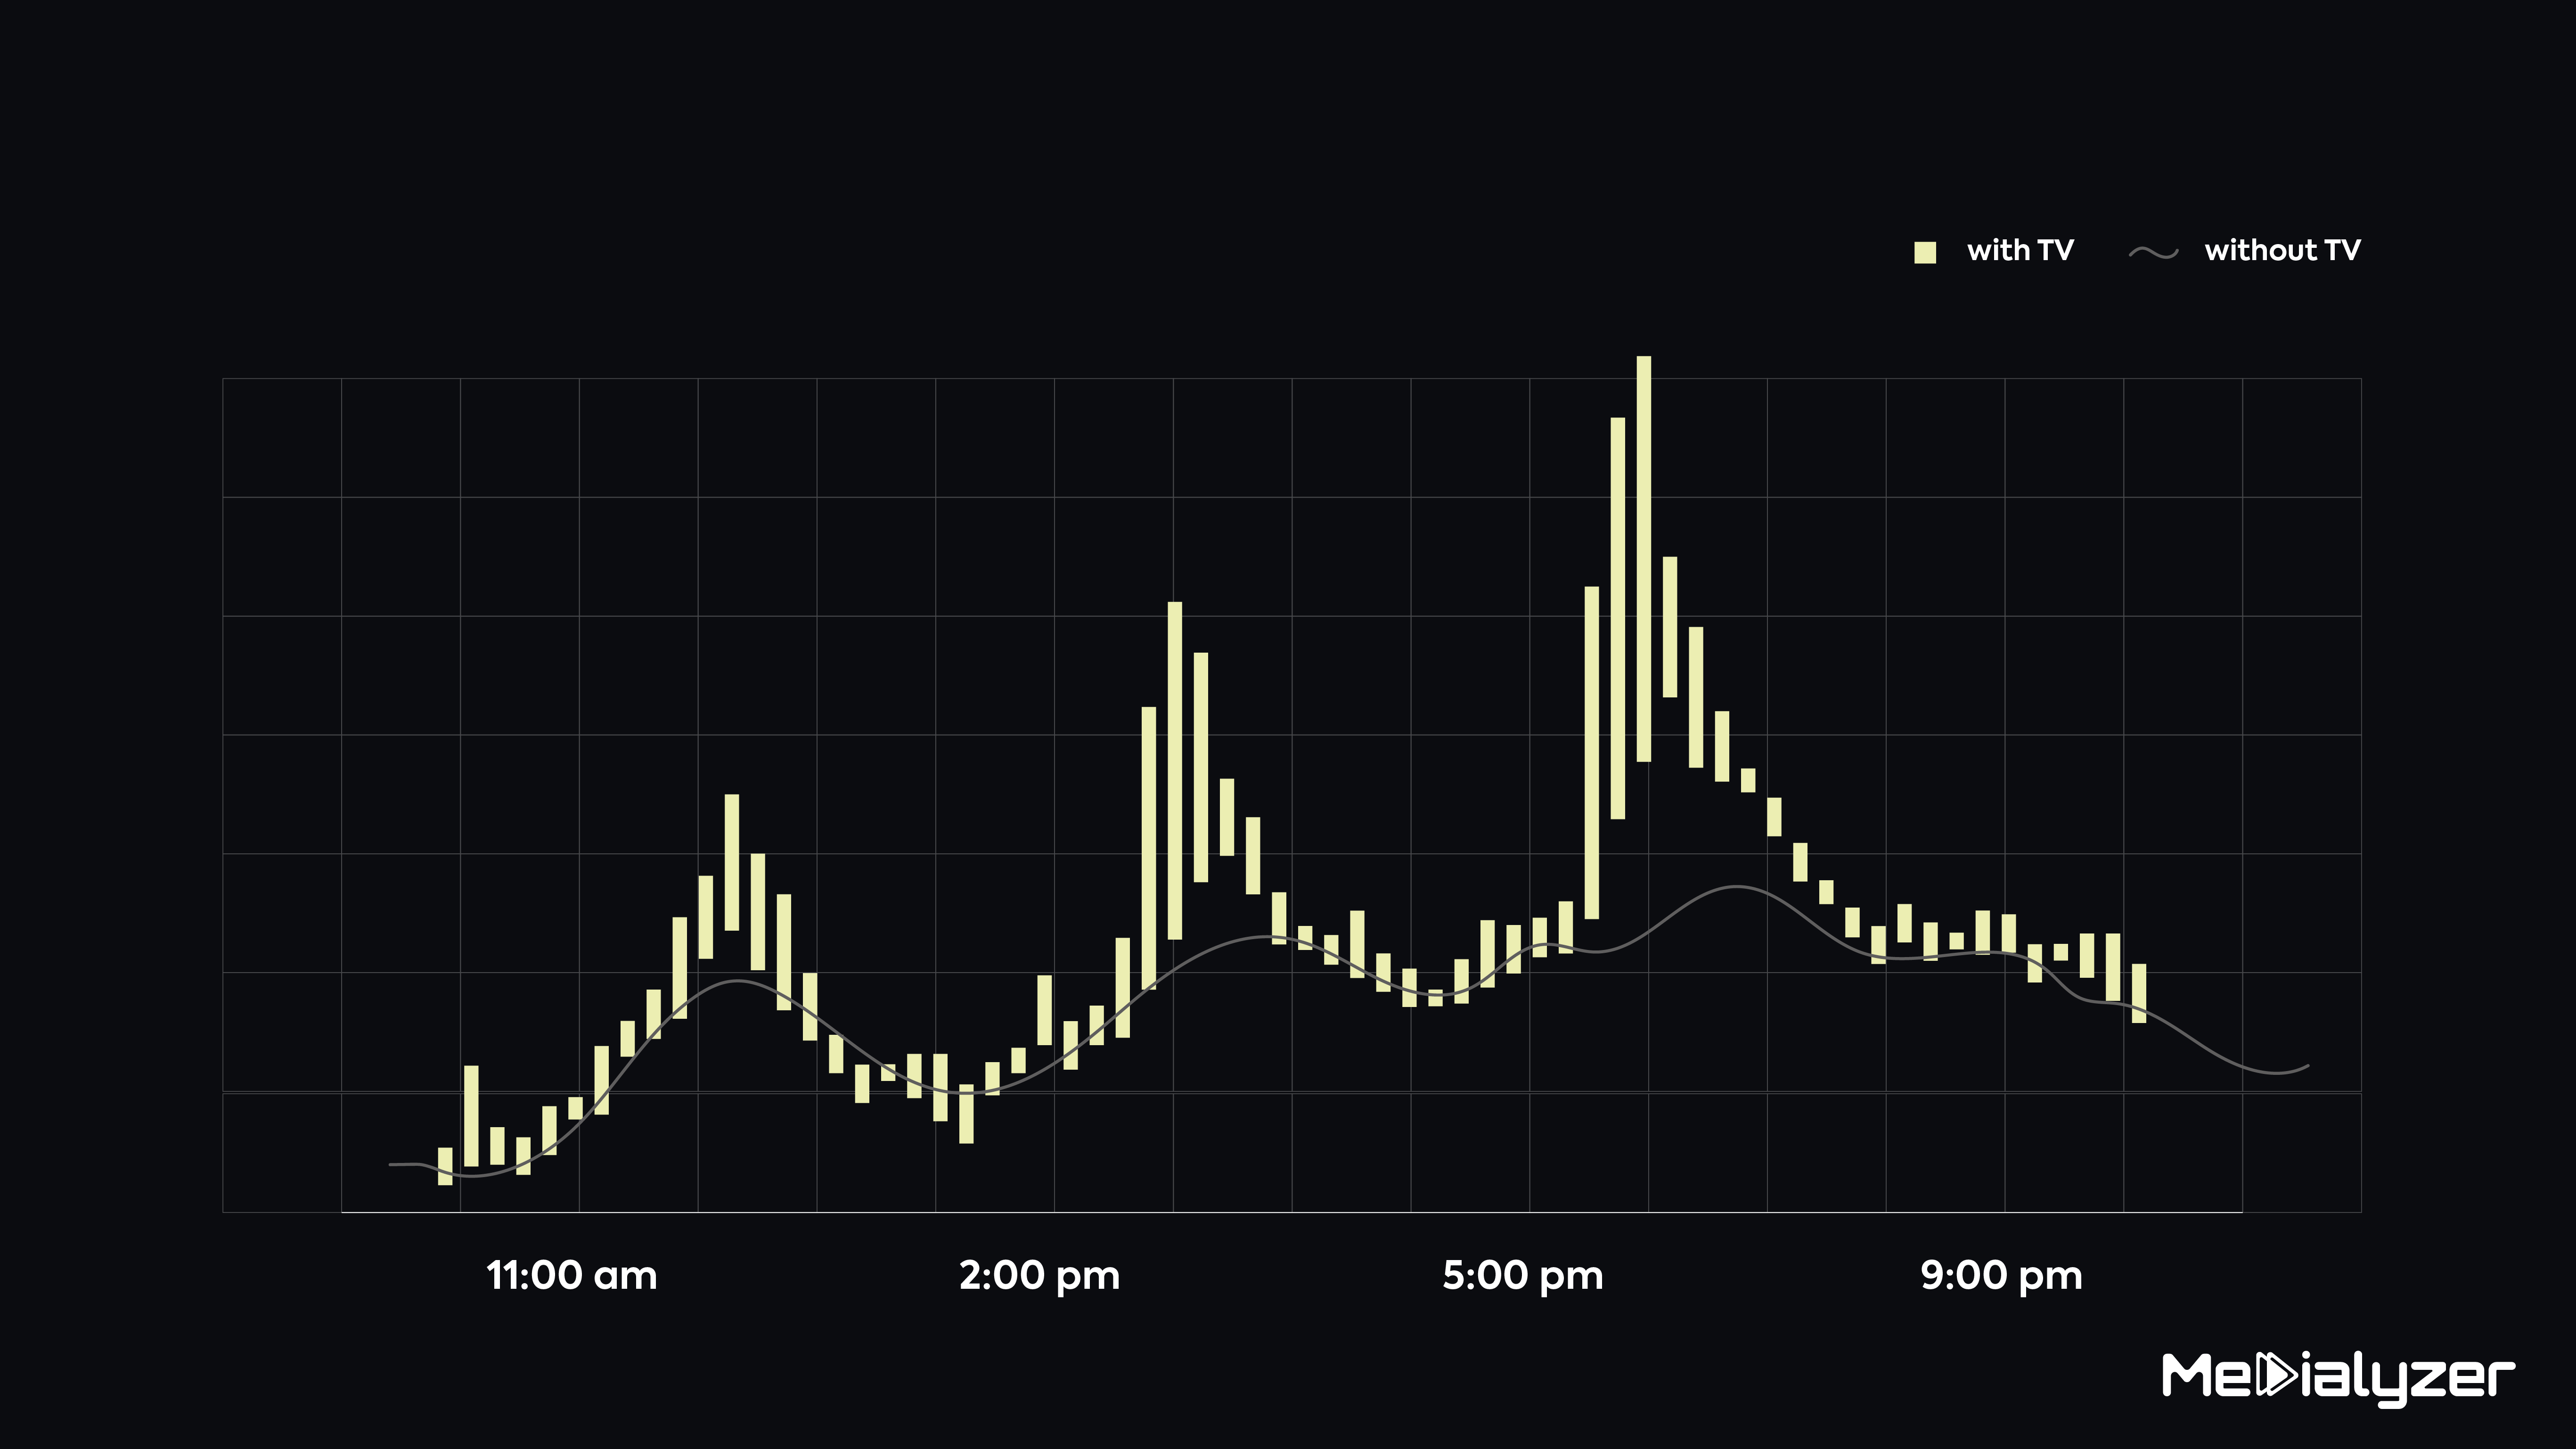
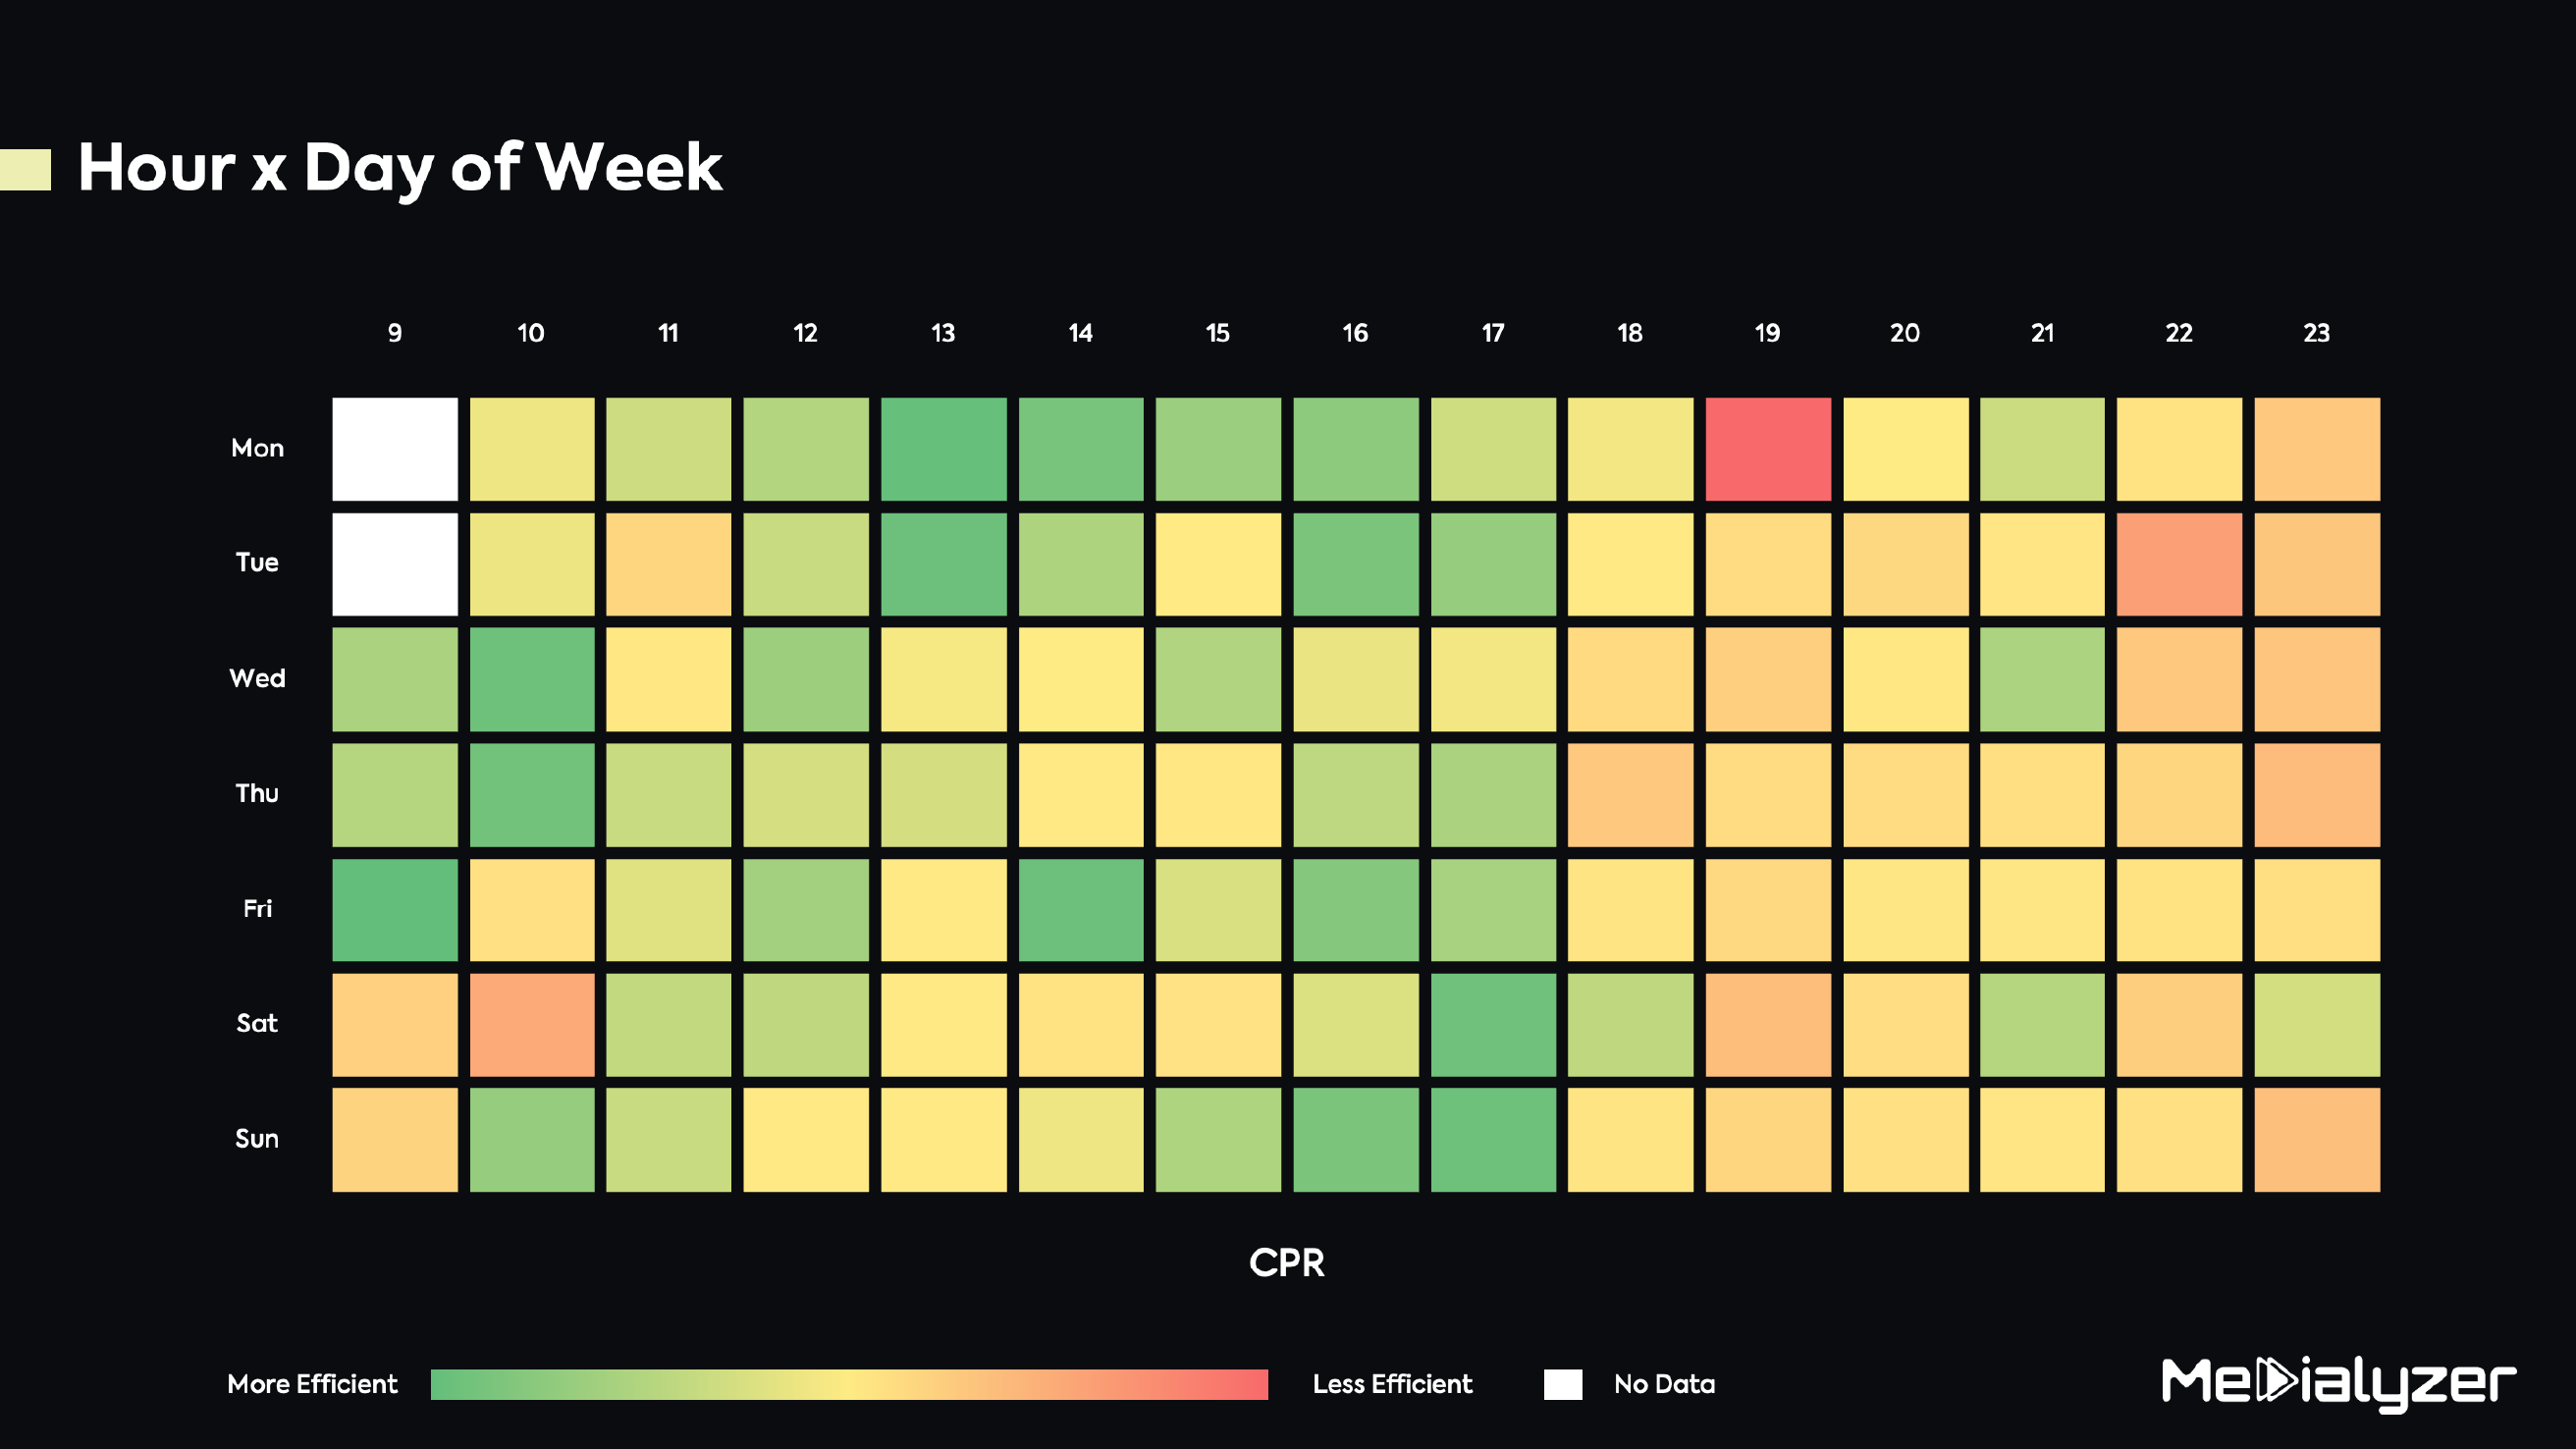
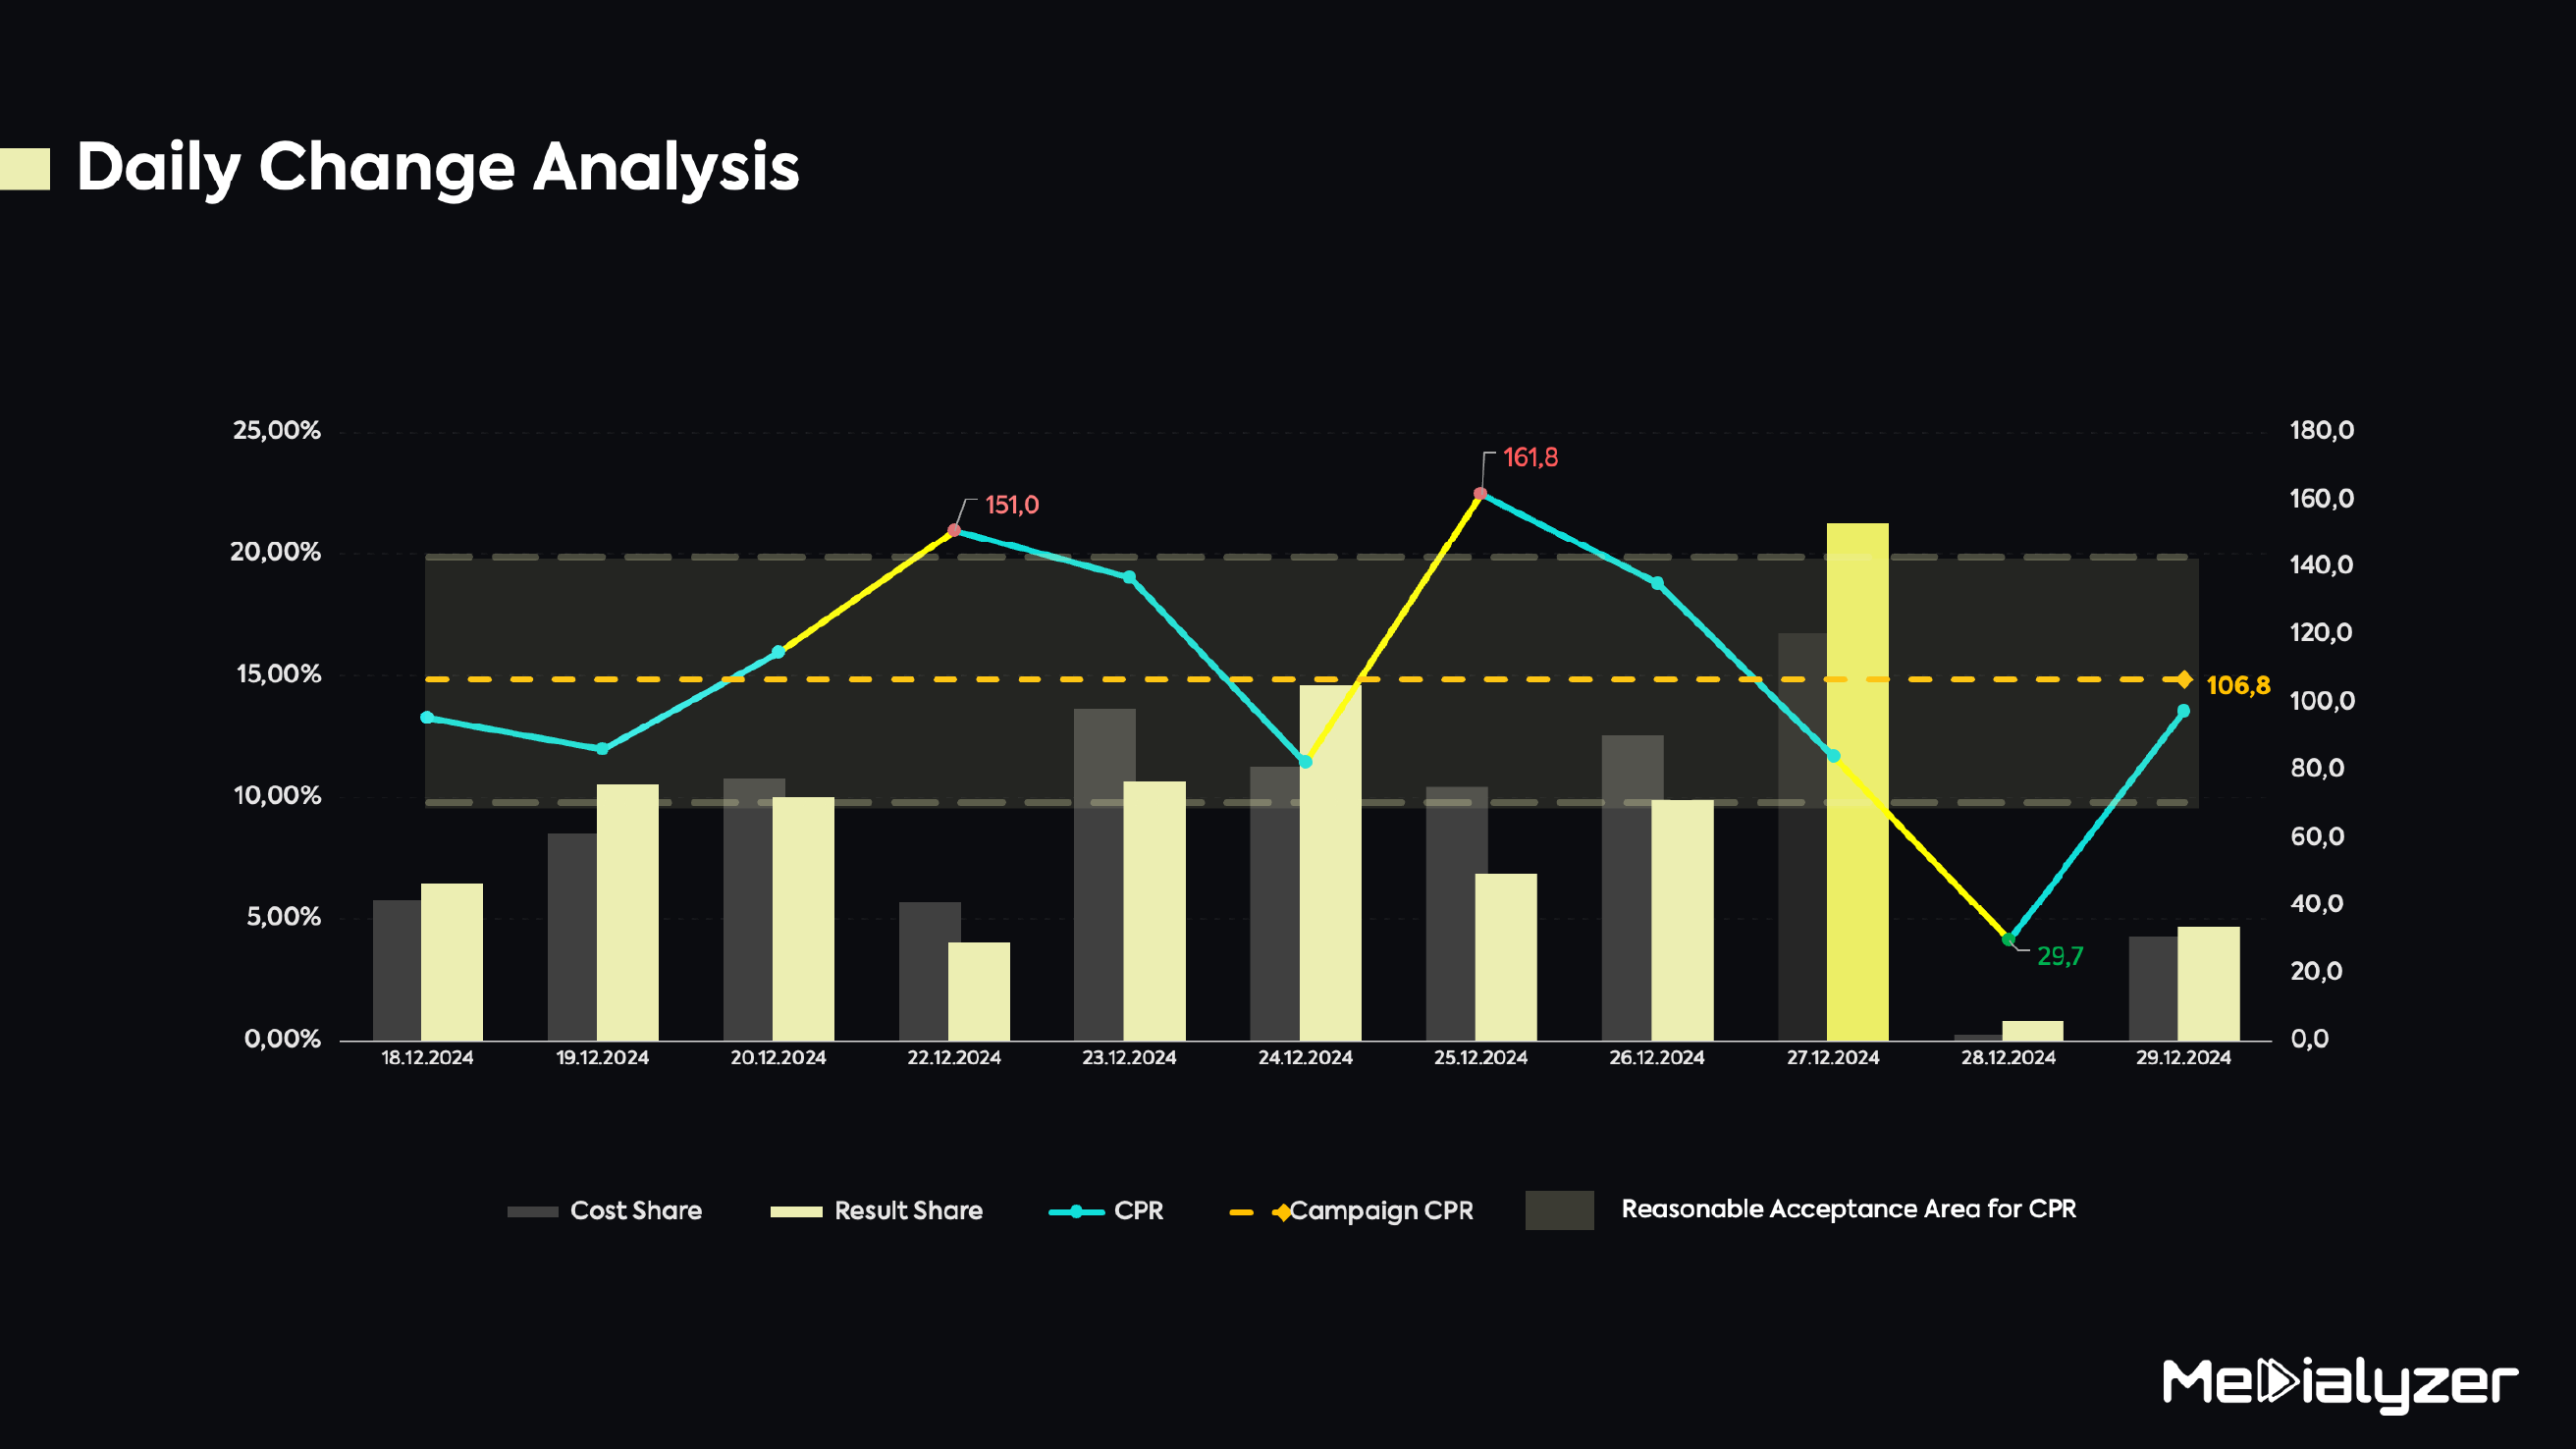
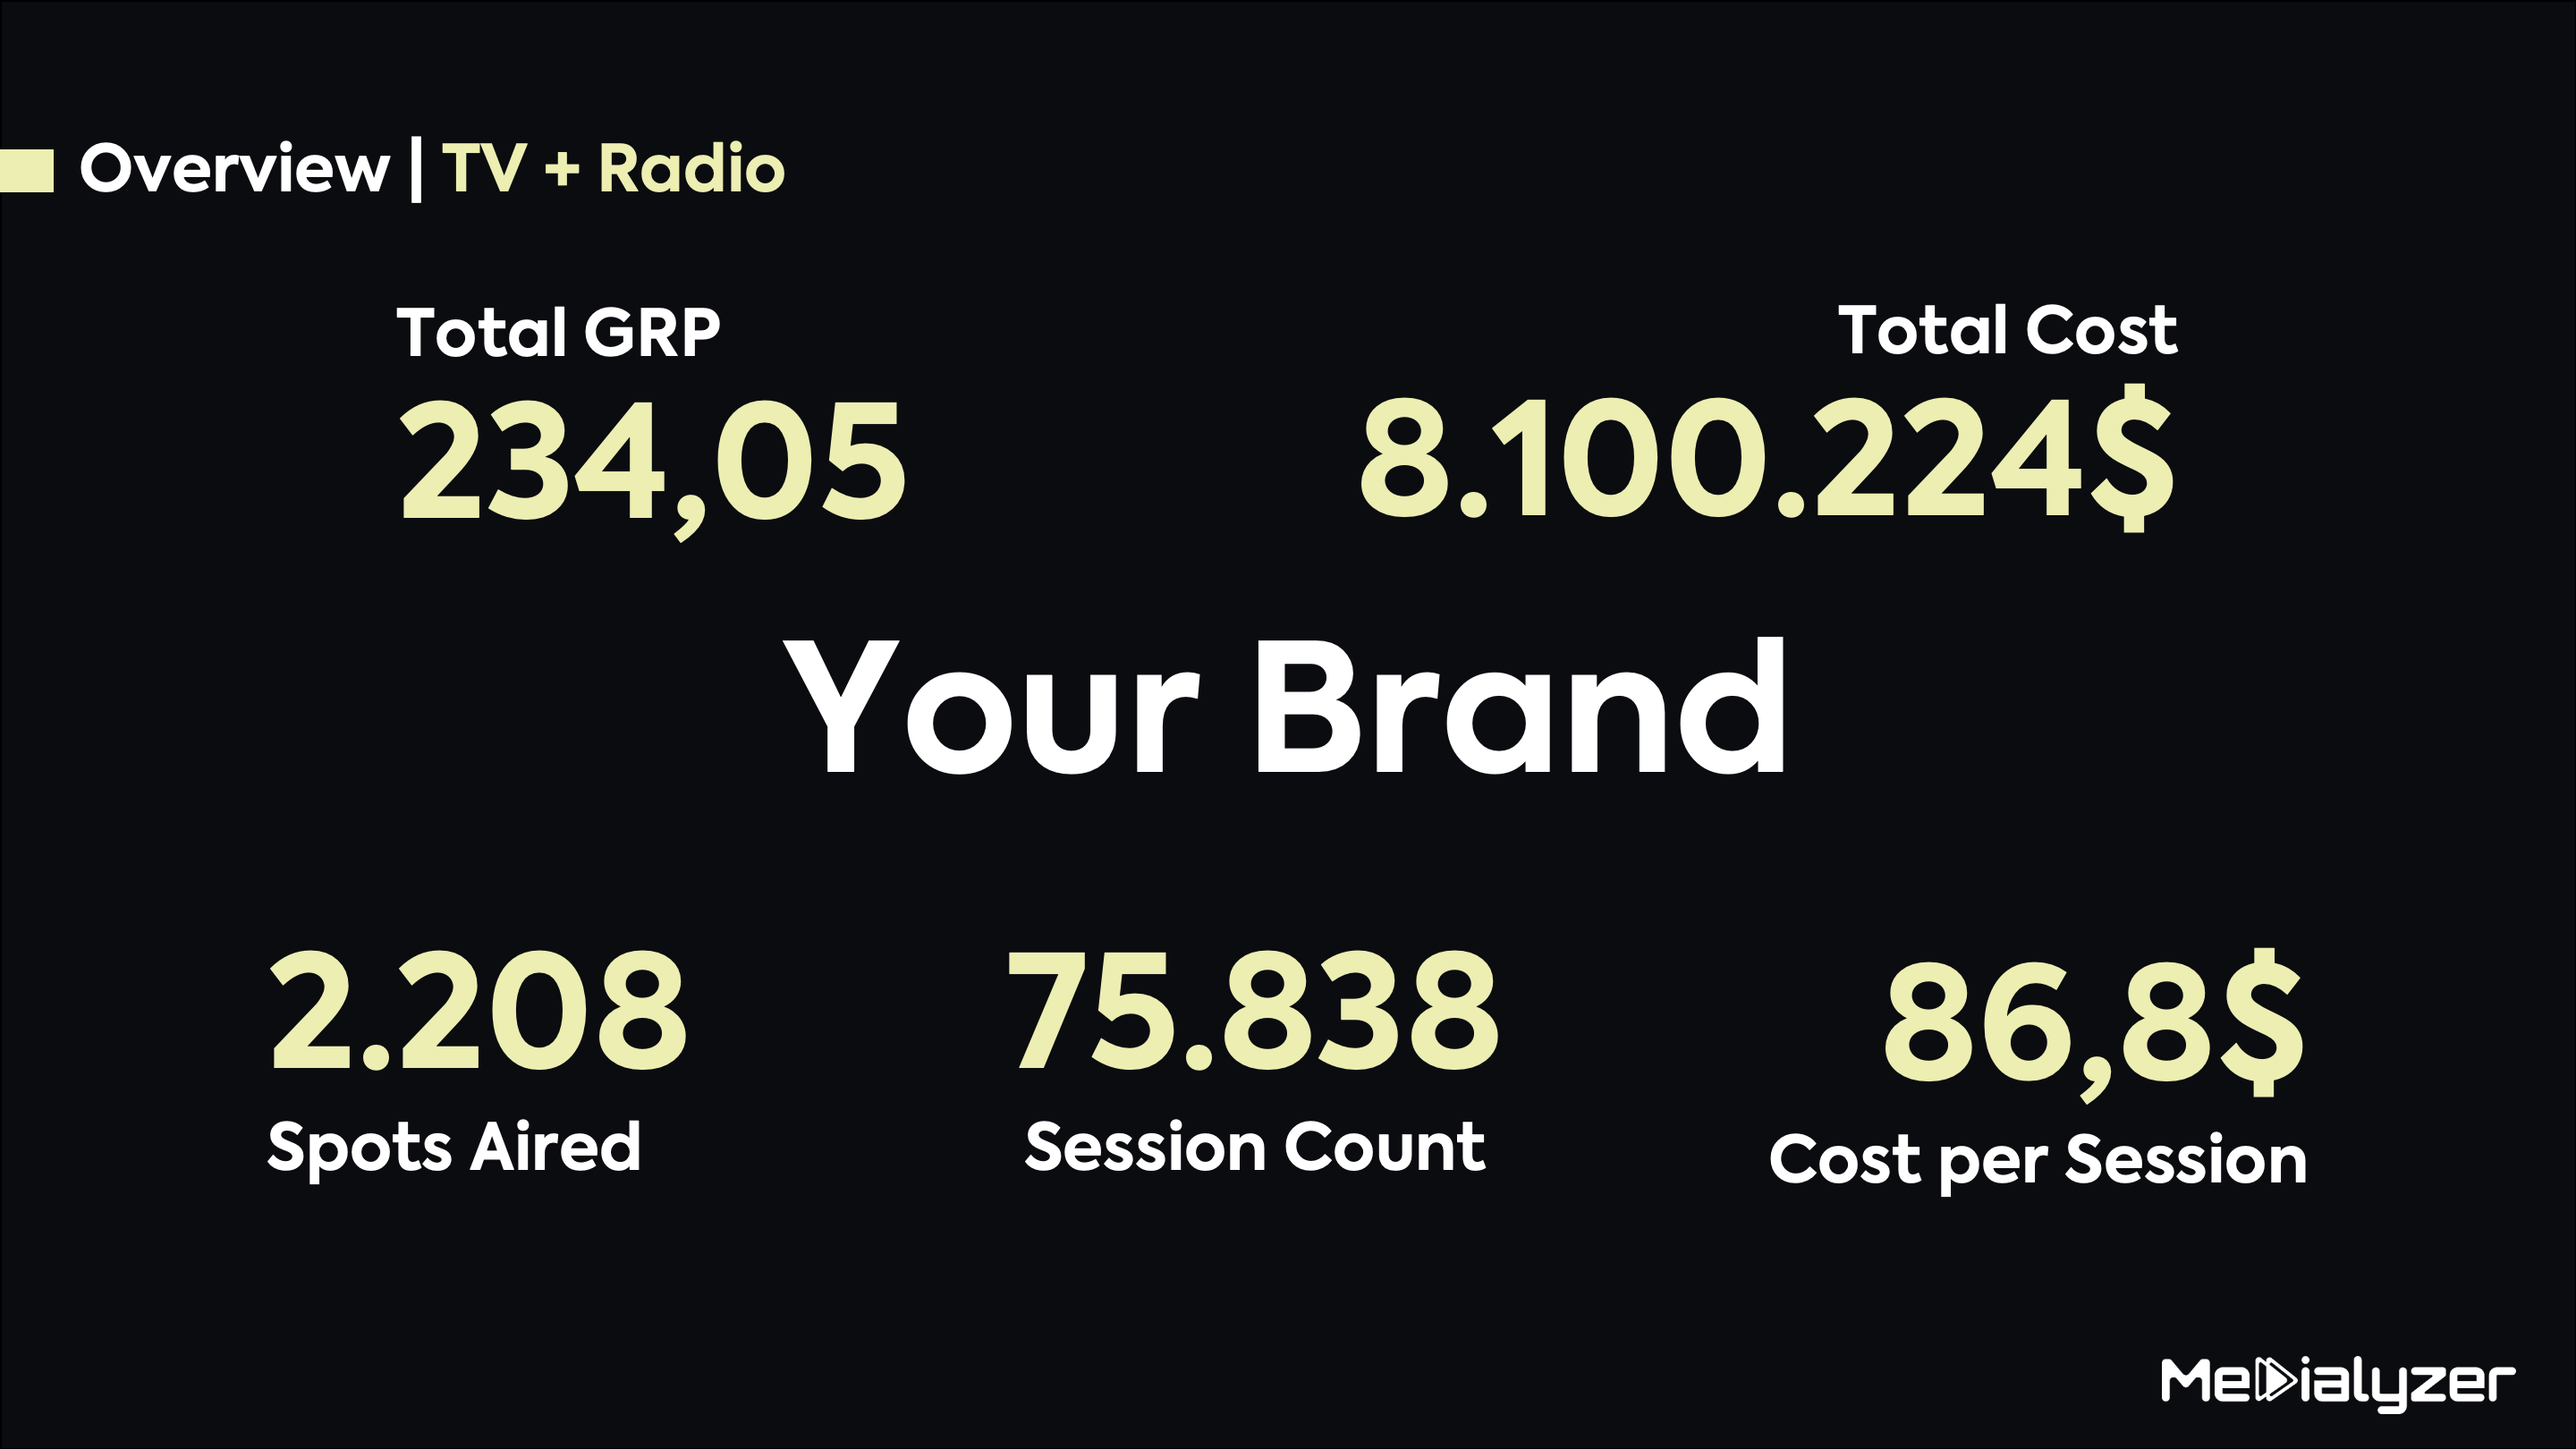
Medialyzer TV Attribution shows how each TV spot influences your digital outcomes through marketing-friendly dashboards. See which channels, dayparts, days of week, hours of day, programs, and creatives drive installs, web sessions, sign-ups, or purchases—and reallocate budget with confidence.
Measurable Data
Identify the TV placements that actually move your KPIs (installs, sessions, conversions).
Clear Performance Reports
Compare performance by channel, daypart, day of week, hour of day, program, and creative.
Proven Outcomes
Quantify incremental lift versus baseline to avoid vanity metrics.
Action
Shorten the feedback loop and optimize mid-campaign.
Core Features That Power
Smarter TV Decisions
Integrations &
Data Sources
Medialyzer easily integrates with the tools you already use, ensuring smooth data flow across mobile, web, and enterprise environments—so you can activate attribution without friction.
Mobile/App
Adjust
AppsFlyer
Web Analytics
GA4
Medialyzer Script
On-Premise
On-premise setup upon request
Step-by-Step
Workflow:
Turning TV Airings
into Actionable
Plans
Ingest and Consolidate TV Airings with Digital Outcome Data
Gather raw logs of all TV spots together with digital events such as installs, sessions, sign-ups, or purchases, and prepare them in a unified dataset.
Model Incremental Lift at the Spot and Dimension Level
Apply attribution models to estimate the incremental effect of each individual spot, breaking results down by channel, program, daypart, creative, day of week, and hour of day.
Visualize Results and Execute Budget Reallocation
Render dashboards that present spot-level performance, highlight patterns across dimensions, and provide the structured output needed to shift budget toward more effective placements.
and Ready!
FAQs
Find clear, concise answers to the most common questions about our products and how they work.
Installs, sessions, sign-ups, purchases (custom events on request).
Yes, graph PNGs, spot data XLSX and PDF exports are available.